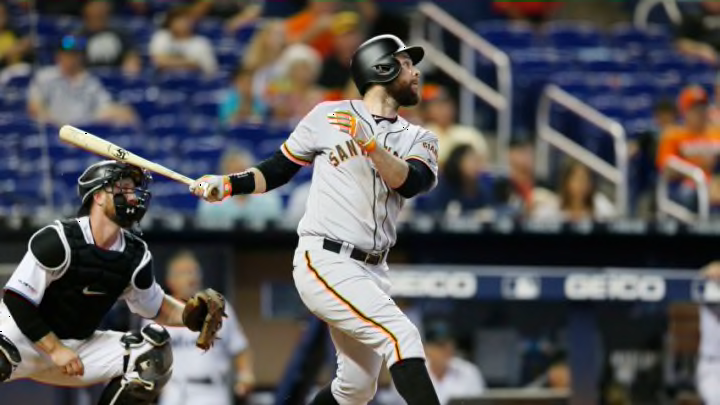
Despite their sub-.500 record, this year’s version of the San Francisco Giants are showing signs of improvement. Some are big, and some are small.
After 90 games, the San Francisco Giants have a big enough sample size to begin drawing conclusions. So far this season, the team is walking more and striking out less.
While these improvements are incremental in nature, they at least show the team is tending in the right direction.
In 2018, the Giants posted a 24.0 percent strikeout rate compared to a 7.3 percent walk rate, ratios that ranked near the bottom of the league. In total, they struck out 1,467 times, but it certainly felt like it was even worse than that.
Only the San Diego Padres, Philadelphia Phillies, Chicago White Sox, and Texas Rangers struck out more times last season.
A high strikeout rate is a problem for any team, but it’s an especially troubling trend for a team like the Giants that does not hit for power.
So far, the Giants have recorded a 23.1 percent strikeout rate against an 8.0 percent walk rate.
Those are both modest improvements over last season and represent numbers closer to the middle of the pack.
Brandon Belt, Evan Longoria, Joe Panik, Tyler Austin, and Alex Dickerson are driving the improvements in walk rate. Each one has a walk rate above nine percent with a minimum of 50 plate appearances.
So does it really matter that the San Francisco Giants are walking more and striking out less?
Correlation does not equal causation, but it is difficult to ignore the relationship between teams with lower strikeout rates and higher walk rates relative to the rest of the league and their corresponding win-loss record.
The table below shows the top-four teams in terms of strikeout rate compared to the bottom-four teams as well as their corresponding record.
The Houston Astros and Minnesota Twins have two of the lowest strikeout rates in baseball and they sit comfortably in first place in their respective division. The correlation may not be strong, but there seems to be a relationship between these two factors.
That relationship gets a bit messy with the Texas Rangers as they strike out a lot, but also boast a better record than the Los Angeles Angels, who strike out less than any team in baseball.
Similarly, the teams with the highest strikeout rate tend to have records below .500. In the case of the Detroit Tigers, their record is significantly below .500.
By contrast, the following table shows the top-four teams in terms of walk rate compared to the bottom-four teams as well as their corresponding record.
The correlation in this data set is a little better than the strikeout data. Three of the four teams who boast the highest walk rates are also in first place in their respective division. The Milwaukee Brewers are the lone exception, but they are only 1.5 games behind the Chicago Cubs in the standings.
Similarly, the teams with the four lowest walk rates all have records below .500. In the case of the Baltimore Orioles and Miami Marlins, their records are significantly below .500.
So does it matter that the Giants have improved in these areas??
The answer is not completely clear, but it is fair to say that there is a correlation between walk rate and strikeout rate and a team’s corresponding win-loss record.
The improvements the San Francisco Giants have shown in both categories are incremental in nature, and they have a long way to go before they catch up to teams like the Dodgers and Astros with respect to walk and strikeout rates.
However, it is a positive sign that they are trending in the right direction. This is especially encouraging given team president Farhan Zaidi’s preference for targeting players who demonstrate good strike zone awareness. That approach seems to be paying off.
