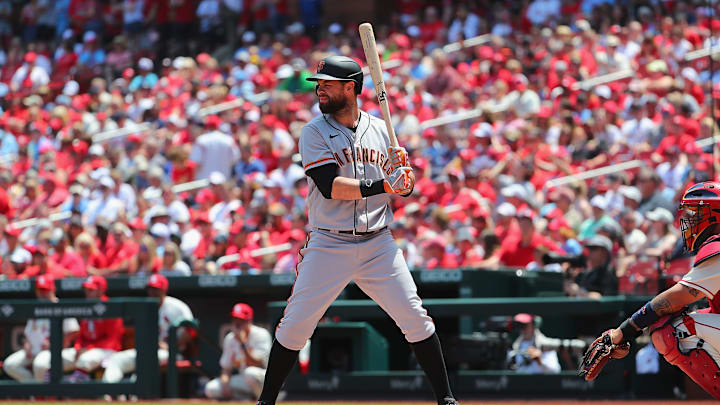
I check in on this metric about once every year and it is interesting to see how a team performs in this area and the corresponding win-loss record. This year seems to be no different and that is good news for the SF Giants.
SF Giants offense is excelling in key metric at the plate
That metric is offensive walk-to-strikeout (BB/K) ratio. As a team, the Giants have posted a 0.44 BB/K ratio in 2022. This comprises of a 10.0 percent walk rate against a 22.7 percent strikeout rate. The walk rate is the second-highest mark in baseball behind only the Los Angeles Dodgers, who have registered a 10.3 percent walk rate.
So, why does this even matter? Teams with a good BB/K rate tend to have a better overall record. This is more of a correlation than causation but it is an interesting trend. Conversely, teams with poor BB/K ratios tend to be much lower in the standings. Does that hold true in 2022?
Below are the top teams in BB/K ratio in baseball along with their corresponding win-loss record in parentheses:
1. Houston Astros - 0.48 BB/K (43 - 25 record)
2. Dodgers - 0.48 BB/K (42 - 25 record)
3. New York Yankees - 0.45 BB/K (50 - 18 record)
4. Giants - 0.44 BB/K (38 - 30 record)
5. San Diego Padres - 0.43 BB/K (44 - 27 record)
Do you notice a theme? All five terms are in the top eight in baseball in terms of winning percentage. Three of the five teams listed (Dodgers, Yankees, and Astros) are in first place in their respective division.
The Yankees and the Astros are not only in first place in the AL East and the AL West, respectively, but they have a sizable lead. Of course, the other three teams play in the NL West.
The Giants (29.1 % O-Zone %) and the Dodgers (28.4 % O-Zone %) are two of the top three teams in terms of not swinging at pitches outside of the strike zone. That is certainly a factor that explains their high walk rates.
The bottom-five teams in terms of BB/K ratio are listed below with their corresponding record in parentheses:
26. Texas Rangers - 0.32 BB/K ratio (33 - 35 record)
27. Atlanta Braves - 0.32 BB/K ratio ((40 - 30 record)
28. Baltimore Orioles - 0.31 BB/K ratio (30 - 39 record)
29. Oakland A's - 0.31 BB/K ratio (23 - 46 record)
30. Detroit Tigers - 0.27 BB/K ratio (26 - 43 record)
What are the Braves doing there?! There is a perfectly reasonable explanation for them. They are not the most patient hitters, but their players have incredible game power. They compensate for a lack of patience with the ability to out-homer their opponents. Only the Yankees (115 home runs) have hit more homers than the Braves (106 home runs) in 2022.
The remaining four teams are some of the worst in baseball. The Orioles and A's have the worst record in the AL East and AL West, respectively. Unfortunately, the A's also have the worst record in baseball.
The Tigers are just one game ahead of the Kansas City Royals for the worst record in the AL Central. In a bit of an oddity, the Rangers are in second place in the AL West, but it bears mentioning that they play in a weak division.
It is not a perfectly linear correlation but few things in life are. I think this is all to point out that a good process like walking at a high rate relative to striking out tends to lead to the desired outcome of more wins. What it means for the Giants is that they tend to consistently have a good process at the plate and remain competitive due in part to this.
