San Francisco Giants: 3 Stats That Show Bryce Harper’s Potential Impact

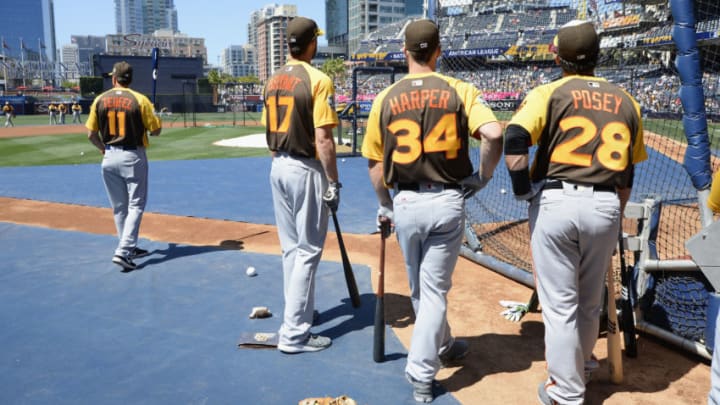
SAN DIEGO, CA - JULY 12: Kris Bryant #17 of the Chicago Cubs, Bryce Harper #34 of the Washington Nationals and Buster Posey #28 of the San Francisco Giants warm up prior to the 87th Annual MLB All-Star Game at PETCO Park on July 12, 2016 in San Diego, California. (Photo by Denis Poroy/Getty Images)
2 of 4
Next
SAN DIEGO, CA – JULY 12: Kris Bryant #17 of the Chicago Cubs, Bryce Harper #34 of the Washington Nationals and Buster Posey #28 of the San Francisco Giants warm up prior to the 87th Annual MLB All-Star Game at PETCO Park on July 12, 2016 in San Diego, California. (Photo by Denis Poroy/Getty Images)
SAN DIEGO, CA – JULY 12: Kris Bryant #17 of the Chicago Cubs, Bryce Harper #34 of the Washington Nationals and Buster Posey #28 of the San Francisco Giants warm up prior to the 87th Annual MLB All-Star Game at PETCO Park on July 12, 2016 in San Diego, California. (Photo by Denis Poroy/Getty Images) /

The San Francisco Giants are rumored to be near the top of the list when it comes to the Bryce Harper Sweepstakes. So here are 5 stats that show Bryce Harper‘s potential impact on the Giants.

I don’t know how else to say it, but the San Francisco Giants have to do whatever it takes to bring Bryce Harper to the bay.

He is a superstar that commands that people pay attention to him through his play on the field. His mere presence in the lineup takes away just a little attention that was being paid to everyone else, and there is intangibles everywhere that happen, simply by putting Bryce Harper in a lineup 150 times during a season. There is no denying that if there was one singular acquisition that could turn the Giants fortune at the plate around, he’s the one who would do it.

In 2018, the Giants lost only 20 games when scoring 4 runs or more. They played in 72 such games. So 52-20 in games where they scored more than 4 runs. However, they scored less than that 90 times, going 21-69. They averaged 3.69 runs per game in 2018.

Severe offensive issues clearly were the plague of the Giants, as their pitching was good enough to keep them in ballgames. They allowed more than 4 runs 87 times, which is in just over half their games. However, they usually never let them get entirely out of hand. In only 46 of those games were opponents scoring 6 or more runs. So truly, the Giants’ offensive issues were the death of them in 2018. So here are five stats that show how inserting Bryce Harper into that lineup could almost singlehandedly turn around the Giants’ fortunes at the plate.

SAN FRANCISCO, CA – JULY 11: Andrew McCutchen #22 and Brandon Crawford #35 of the San Francisco Giants both score on a hit by Gorkys Hernandez #7 of the San Francisco Giants in the first inning against the Chicago Cubs at AT&T Park on July 11, 2018 in San Francisco, California. (Photo by Ezra Shaw/Getty Images)
SAN FRANCISCO, CA – JULY 11: Andrew McCutchen #22 and Brandon Crawford #35 of the San Francisco Giants both score on a hit by Gorkys Hernandez #7 of the San Francisco Giants in the first inning against the Chicago Cubs at AT&T Park on July 11, 2018 in San Francisco, California. (Photo by Ezra Shaw/Getty Images) /

The first of these three stats is a pretty simple one, offensive WAR (oWAR). WAR in general is a difficult stat to quantify to an exact thing. It’s a relatively devisive stat mainly because of that. But what it does give us is a direct comparison to each other’s offensive output. For the purposes of this article, we used BBREF’s oWAR.

The 2018 San Francisco Giants only had one player with at least a 2.0 oWAR, and his name was Brandon Crawford. The two closest to him were Buster Posey and Andrew McCutchen, both with 1.9 oWAR. Those values are honestly quite miserable. So let’s look at their “mainstream stats” put together so I can give those who either don’t believe in WAR, or don’t understand it enough yet.

The combined slash-line for those three is good for .263/.382/.395/.776. Throw in the totals for individual events and you’re looking at 34 homers, 150 RBI, 298 k’s, 168 BB, and 59 non HR xbh. For three guys that’s not a whole lot.

Let’s take a look at what would happen if you swapped out Bryce Harper and his 4.2 oWAR for Andrew McCutchen though, which would proverbially be 2019’s situation:

  • They score 35 more runs, which bumps their runs per nine inning rate from 3.69 to 3.93 (nearly the 4 we’re looking for!)
  • OPS jumps 70 points, and slugging percentage jumps 61 points. More XBH usually means more runs (duh)
  • Oh and the OBP jumped 30 points, so more guys on base (which also equals more runs)

However, that’s to be expected when you add a guy that’s worth both of your top to oWAR players combined.
PHOENIX, AZ – JUNE 29: Catcher Buster Posey #28 of the San Francisco Giants in action during the MLB game against the Arizona Diamondbacks at Chase Field on June 29, 2018 in Phoenix, Arizona. (Photo by Christian Petersen/Getty Images)
PHOENIX, AZ – JUNE 29: Catcher Buster Posey #28 of the San Francisco Giants in action during the MLB game against the Arizona Diamondbacks at Chase Field on June 29, 2018 in Phoenix, Arizona. (Photo by Christian Petersen/Getty Images) /

The biggest part about the next number is that it doesn’t change all the calculations we’ve done for the previous slide. Same calculations and same look at everything, but instead of using Buster Posey‘s 2018 stats, we decided to insert his career average.

Everyone knows that Buster Posey had an extremely difficult 2018 season that was marred by injury. His numbers were so far down that it’s difficult to envision him having the same type of 2019, especially if he comes back healthy. So let’s look at what those slash-lines, averages and other fun things would be if we inserted Buster Posey’s career average totals instead of his severely below average 2018:

  • average receives a 20 point boost
  • OBP stays roughly the same, slugging percentage jumped another 10 points
  • OPS jumps yet another 30 points
  • Runs per game goes from 3.93 to 4.12

So getting Buster Posey back to healthy, plus adding Bryce harper almost instantly turns this team from one of the worst offensive teams into a relatively average offensive team. I won’t go in and make every other Giants player play to their career average because that takes a ton of time, and none of the other Giants’ performances in 2018 were as abnormal as Posey’s.

But overall, that’s a huge shot in the arm offensively if the Giants even get a career average Posey back. Imagine the shot in the arm it would be to add Harper to the outfit?

WASHINGTON, DC – SEPTEMBER 26: Bryce Harper #34 of the Washington Nationals jogs off the field during the end of the third inning against the Miami Marlins at Nationals Park on September 26, 2018 in Washington, DC. (Photo by Rob Carr/Getty Images)
WASHINGTON, DC – SEPTEMBER 26: Bryce Harper #34 of the Washington Nationals jogs off the field during the end of the third inning against the Miami Marlins at Nationals Park on September 26, 2018 in Washington, DC. (Photo by Rob Carr/Getty Images) /

One of the biggest thing that plagued the Giants offense in 2018 was their ability to hit with runners in scoring position. They were once of the worst teams in baseball at it, posting a .239 average w/RISP. That’s horrendous. 24 of their 133 homers came w/RISP, so they hit 109 solo homers. Yikes.

Granted just having some higher OBP around would help that out a bit. But throwing in Bryce’s OBP of nearly .400, his heavy on base presence would sure help that out quite a bit. But what about what he does w/RISP, and how does that compare to what McCutchen did in 2018?

More from Around the Foghorn

With Runners in scoring position in 2018, McCutchen slashed .224/.362/.411/.779. His numbers without any runners on base were significantly better. He brought in 42 runs w/RISP as well. What did Bryce do in 2018?

Harper hit .290/.458/.524/.982 with runners in scoring position in 2018, all significantly higher than his numbers without runners on base. Surprisingly though, he only hit 6 of his 34 homers with runners on base. So how much were non-Harper National’s getting on base?

Well, if you subtract Harper’s numbers from the National’s totals, their team OBP for 2018 drops nearly 30 points, and from second in the league to within the bottom five.

Lesson? Harper’s OBP, and ability to hit with Runners in Scoring Position was almost transformative. If you take them away, their offense turns from a top 5 offense to a slightly below average offense.

Next. 5 Giants Prospects to watch in 2019

Now the Giants do not have as great of a supporting cast as the Nationals did, at least in terms of offensive production. However, it will be very intriguing to see where they land in 2019 without Harper in their lineup, as opposed to just removing his numbers from the equation. And if the Giants were to actually have Harper in the lineup, it would be incredibly intriguing to see what happens to the numbers of everyone around him.

Next